Visualizing r/place in Excel
TL, DR: Download the spreadsheet from here. 🧮
On April’s fools 2017 Reddit launched r/place, a social experiment with simple rules:
There is an empty canvas.
You may place a tile upon it, but you must wait to place another.
Individually you can create something.
Together you can create something more.
A dataset was released afterwards with information about every single edit, all 16 567 567 of them. (Un?)surprisingly, it is possible to visualize the result in Excel.
ts,user,x_coordinate,y_coordinate,color
1490991480000,+++/DjiwyzTQzfai1RGavwwdeF0=,4,33,13
1491081894000,+++/DjiwyzTQzfai1RGavwwdeF0=,600,812,13
1491080275000,+++/DjiwyzTQzfai1RGavwwdeF0=,667,794,13
1491057011000,+++/DjiwyzTQzfai1RGavwwdeF0=,818,874,13
1491142068000,+++/DjiwyzTQzfai1RGavwwdeF0=,819,728,13
1490993278000,+++/DjiwyzTQzfai1RGavwwdeF0=,852,849,13
1490991788000,+++/DjiwyzTQzfai1RGavwwdeF0=,883,876,13
1491224392000,+++/DjiwyzTQzfai1RGavwwdeF0=,927,999,13
1491230148000,+++/DjiwyzTQzfai1RGavwwdeF0=,930,993,13
1491224085000,+++/DjiwyzTQzfai1RGavwwdeF0=,932,998,13
1491237044000,+++/DjiwyzTQzfai1RGavwwdeF0=,941,994,13
...
Preliminary processing
The first step was to get the final canvas from the history. I initially tried (and failed) to do everything in PowerQuery. Either it would process data for hours before showing an error, or it would just collapse.
I wrote a small Python script to filter the most recent changes and pivot the columns horizontally. This step also reduced the csv file size from about 857 MB to less than 3 MB.
import pandas as pd

raw_df = pd.read_csv("tile_placements_sorted.csv")

# Calculate the most recent timestamp for each pair of coordinates
last_changes = raw_df.pivot_table(index=["x_coordinate", "y_coordinate"], values="ts", aggfunc=max)

# Use consistent indexes to allow joining
raw_df.set_index(["ts", "x_coordinate", "y_coordinate"], inplace=True)
last_changes.set_index("ts", append=True, inplace=True)

# Join the color for the most recent change
last_changes = last_changes.join(raw_df, on=["ts", "x_coordinate", "y_coordinate"], how="left")

# Export to csv
last_changes.reset_index(inplace=True)
last_changes.sort_values(["x_coordinate", "y_coordinate", "color"], inplace=True)
last_changes.drop_duplicates(inplace=True)
last_changes = last_changes.pivot_table(index="y_coordinate", columns="x_coordinate", values="color", aggfunc=min, fill_value=0)
last_changes.to_csv("tile_placements_last.csv", index=True)
Importing the data in Excel
I don’t blame Excel for being unable to process hundreds of megabytes of csv. It would habe been a clear example of using the wrong tool for the purpose. What Excel is (strugglingly) able to do is importing the 1000 by 1000 csv with PowerQuery. Now it was time to show some colours.
5,0,0,0,0,0,0,0,0,0,0,0,0,0,0,0,0,0,0,0,0,0, ...
0,15,3,3,3,3,3,3,3,3,3,3,3,3,3,3,3,3,3,3,3, ...
0,3,3,3,3,3,3,3,3,3,3,3,3,3,3,3,3,3,3,3,3,3, ...
0,3,3,3,3,3,3,3,3,3,3,3,3,3,3,3,3,3,3,3,3,3, ...
0,3,3,3,3,3,3,3,3,3,3,3,3,3,3,3,3,3,3,3,3,3, ...
0,3,3,3,3,3,3,3,3,3,3,3,3,3,3,3,3,3,3,3,3,3, ...
...   ...   ...   ...   ...   ...
Colours with conditional formatting
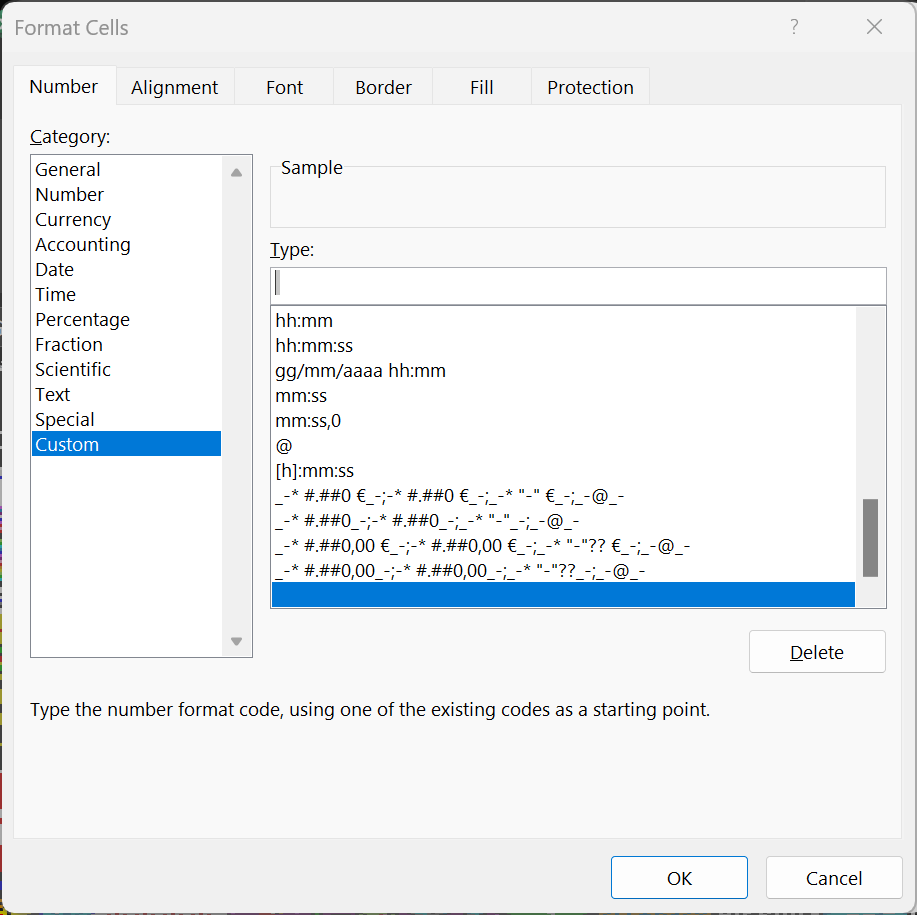
To hide the numbers I just applied a number format with a single white space.
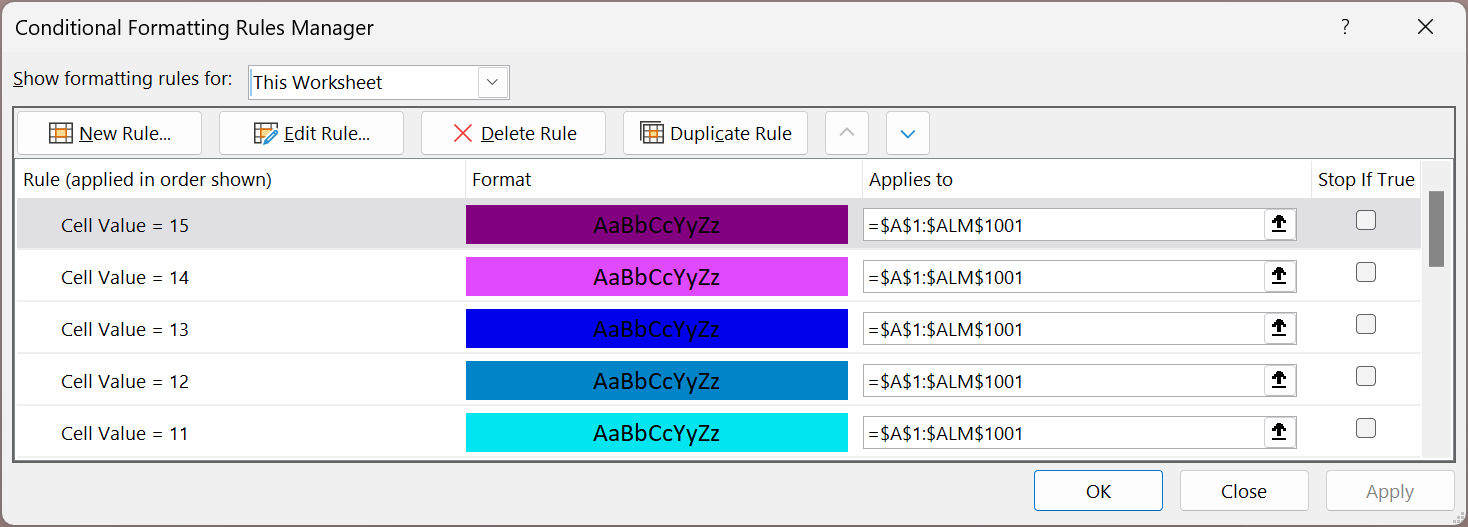
There were 16 colours available, each code corresponding to a hex triplet. For each colour I defined a separate conditional format.
| index | code |
|---|---|
| 0 | #FFFFFF |
| 1 | #E4E4E4 |
| 2 | #888888 |
| 3 | #222222 |
| 4 | #FFA7D1 |
| 5 | #E50000 |
| 6 | #E59500 |
| 7 | #A06A42 |
| 8 | #E5D900 |
| 9 | #94E044 |
| 10 | #02BE01 |
| 11 | #00E5F0 |
| 12 | #0083C7 |
| 13 | #0000EA |
| 14 | #E04AFF |
| 15 | #820080 |
Results
That’s it, r/place in Excel in all its glory. If you want to play with it, you can download it from here.

Links
- Reddit - Place announcement
- Reddit - Place Datasets (April Fools 2017)
- Git repository of the Python script