The metrics that Scrum requires you to use 🧑💻📈
TL, DR: There are none, use whichever metrics help your team or don’t use any at all.
A common misconception in Scrum is that traditional project management metrics, like person days, must be replaced by other metrics like story points or T-shirt sizes1. In reality Scrum doesn’t mandate any specific metric; the Scrum Team is free to use whatever makes sense for the product.
 TEKA0142851 - Swedish National Museum of Science and Technology
Empiricism
Scrum is founded on empiricism, which “asserts that knowledge comes from experience and making decisions based on what is observed”2. As Ken Schwaber puts it3:
Empiricism is the act of making decisions based on what is. Scrum is an empirical process, sometimes described as “the art of the possible.” By this, I mean that we do the best we can with what we have.
Estimates in Scrum are a collaborative process between Developers and the Product Owner45. The Scrum Team decides which metrics to use, if any, as long as they support an empirical approach6.
Examples from the Scrum guide
The Scrum Guide mentions three charts as examples, but no requirements: burn-down charts, burn-up charts, and cumulative flow diagrams6.
For all charts the amount of work on the vertical axis can be quantified freely. A basic metric can be the number of Product Backlog items7 without item sizing. Other measures can be traditional ones, like person days, or Agile ones, like story points.
| Burn-down Chart Amount of work remaining in the backlog over time8. |  |
| Burn-up Chart Amount of work which has been completed over time9. | 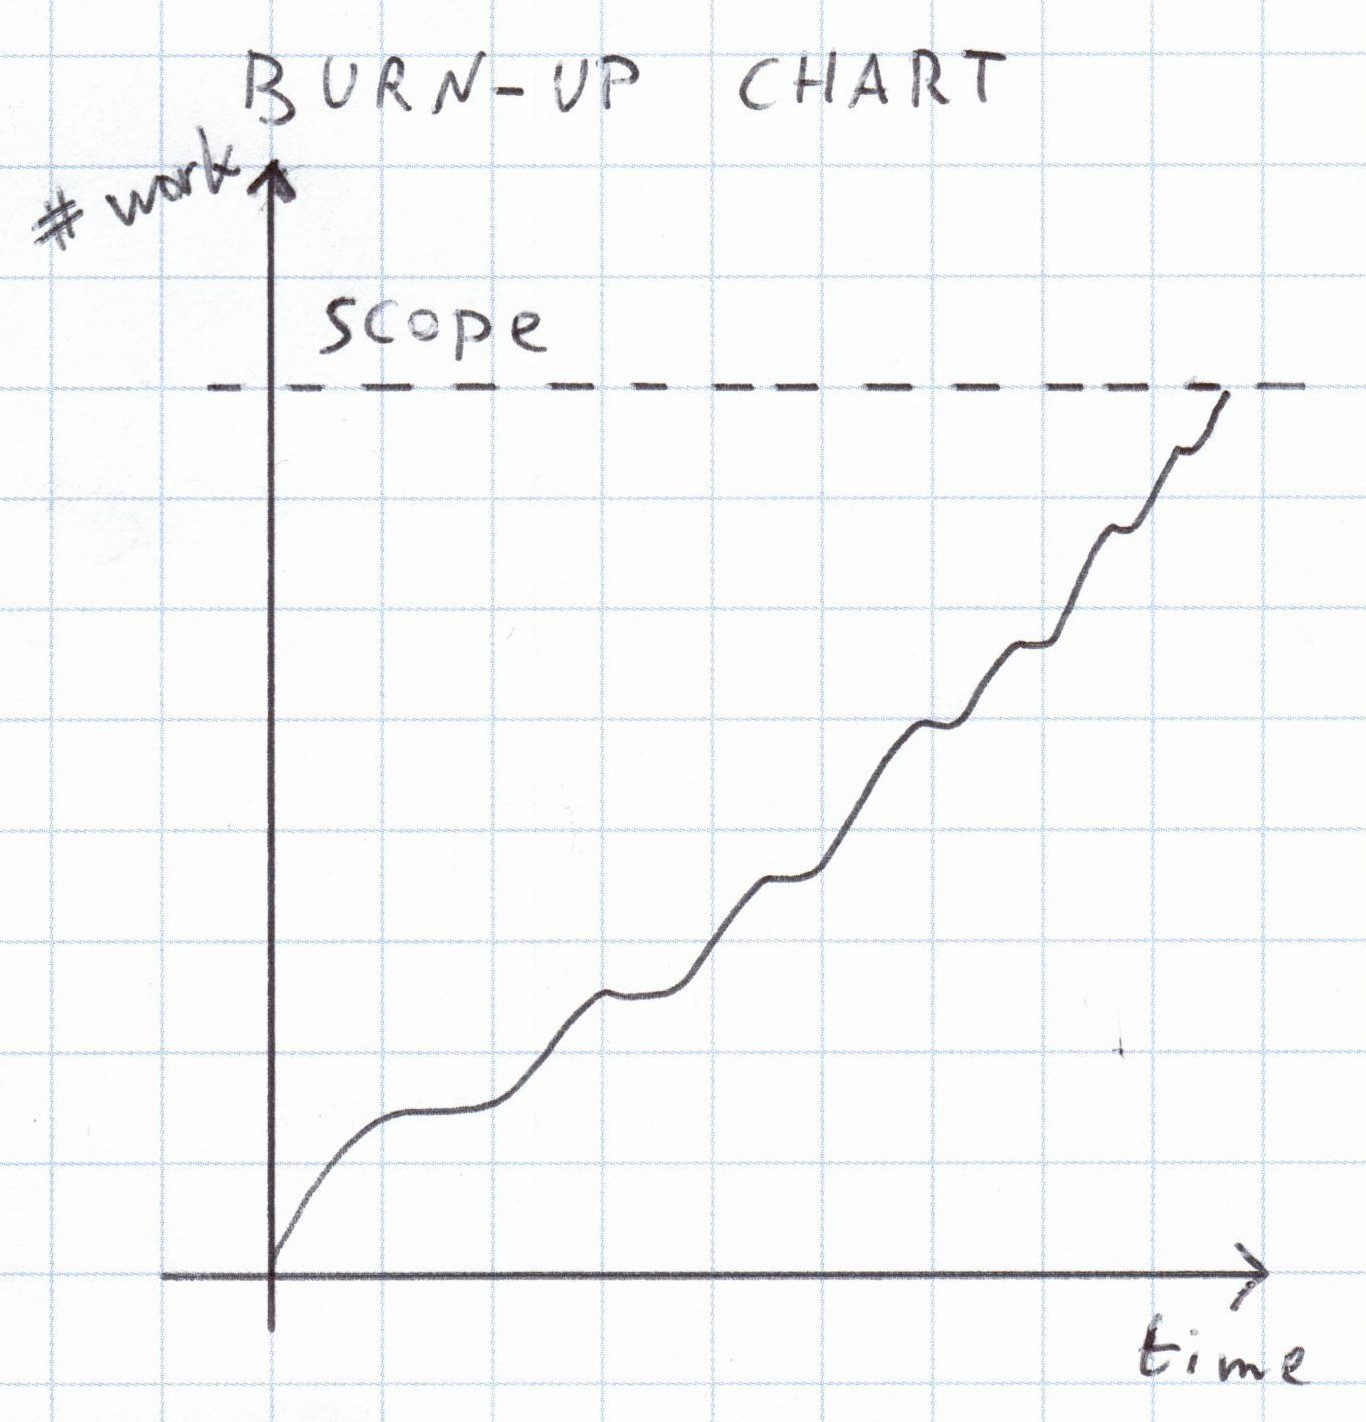 |
| Cumulative Flow Diagram Number of features in different states over time10. | 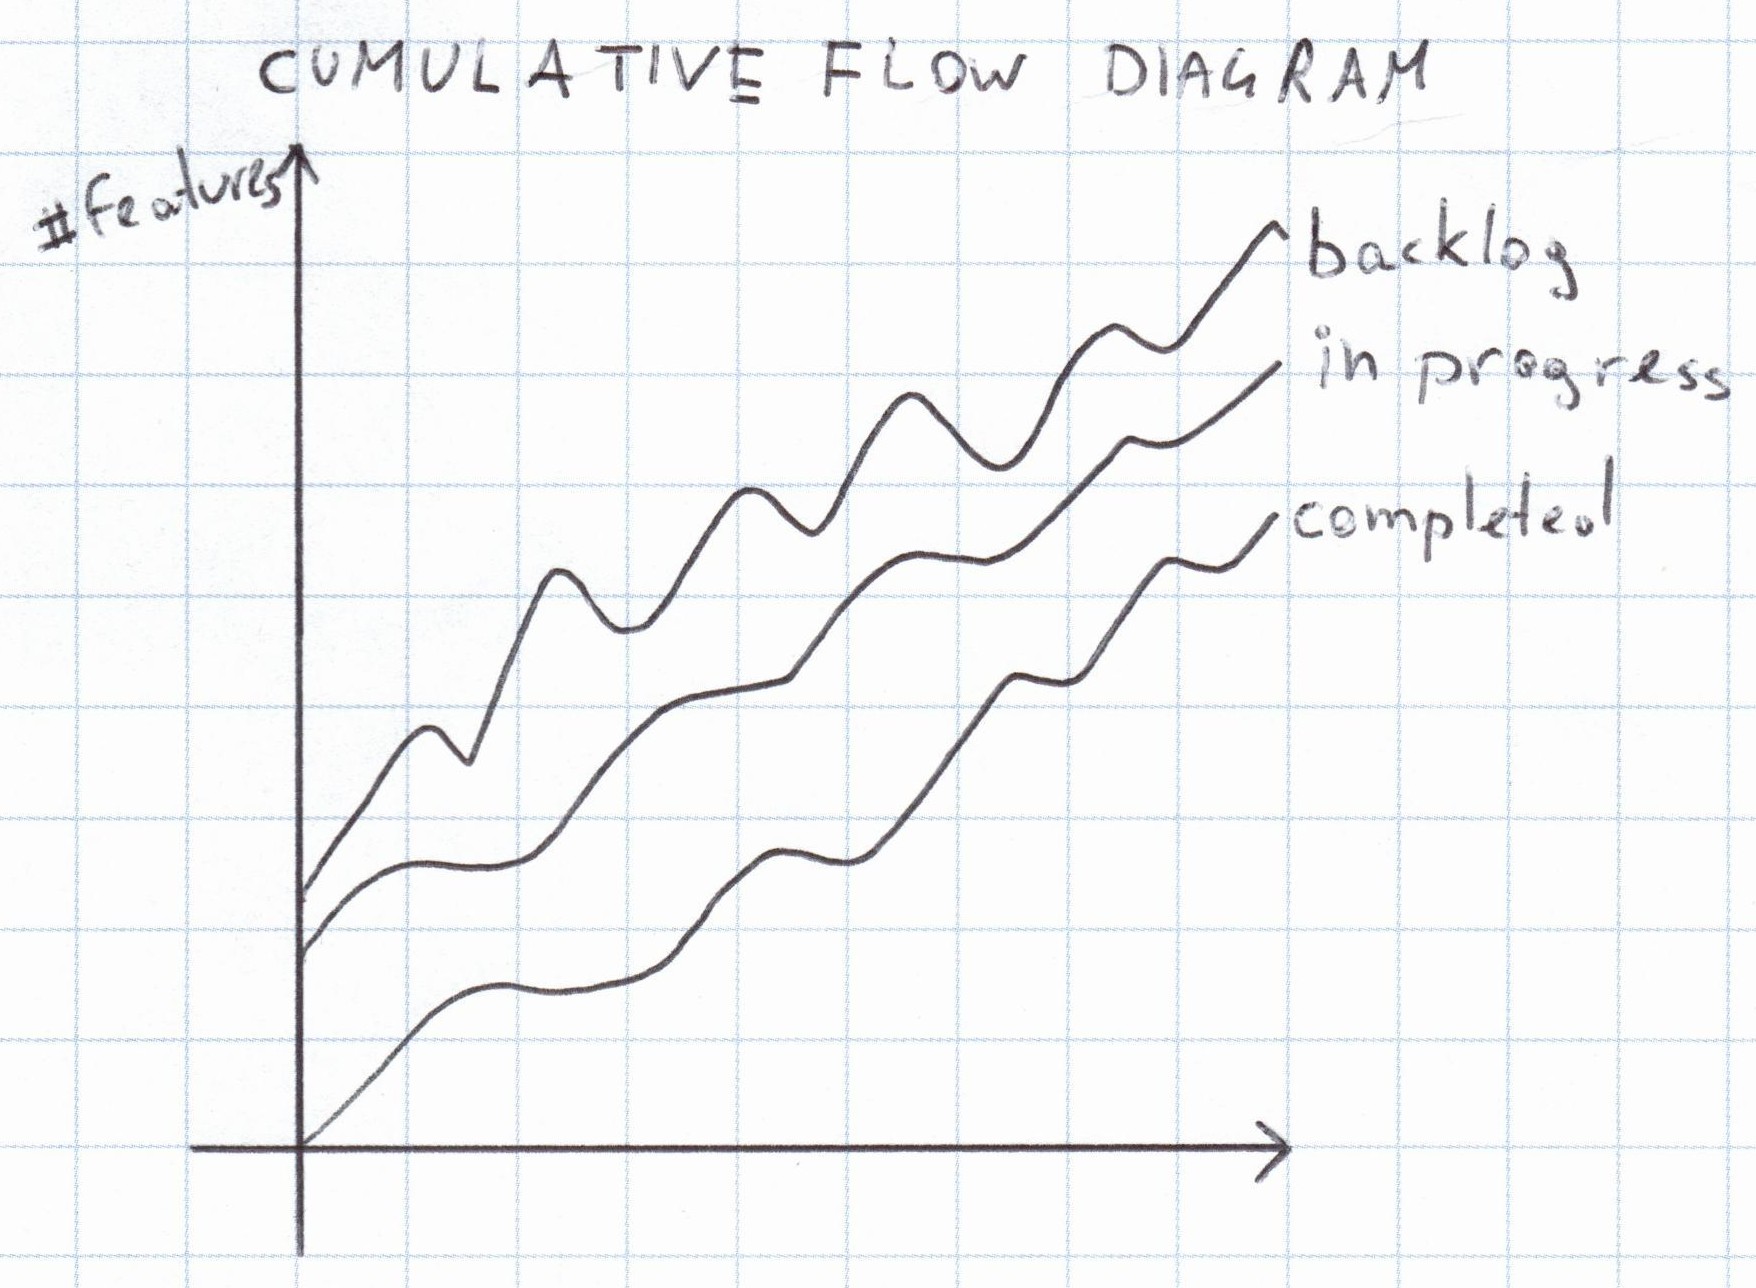 |
Conclusion
Scrum Teams are free to use any metrics that aid learning from experience (empiricism). Start simple and add complexity only as necessary. An educated guess can be a valid estimation technique, especially at the beginning of the product development. If traditional metrics like person days fit the needs of your Scrum Team, use them. Don’t feel obliged to use specific metrics just because they’re included by default in tools like Jira.
Footnotes
-
I also often see implicit conversions, like 1 person day = 1 story point, which defeats the purpose of the metric. ↩
-
2011-05-03 - Ken Schwaber’s Blog - Empiricism, the act of making decisions based on what is ↩
-
“The Developers who will be doing the work are responsible for the sizing. The Product Owner may influence the Developers by helping them understand and select trade-offs.”2 ↩
-
“A Product Owner plans a release based on all current information. He or she lays out the goals, the features and capabilities that will deliver those goals, and the probable cost and date of delivery. […] The Team (of developers) on the Scrum Team does the same. It meets with the Product Owner and assesses what the Product Owner views as the most important things to do next.”3 ↩
-
“Various practices exist to forecast progress, like burn-downs, burn-ups, or cumulative flows. While proven useful, these do not replace the importance of empiricism. In complex environments, what will happen is unknown. Only what has already happened may be used for forward-looking decision making.”2 ↩ ↩2
-
“The Product Backlog is an emergent, ordered list of what is needed to improve the product. It is the single source of work undertaken by the Scrum Team. Product Backlog items that can be Done by the Scrum Team within one Sprint are deemed ready for selection in a Sprint Planning event”2 ↩
-
“Burn-down Chart: a chart which shows the amount of work which is thought to remain in a backlog. Time is shown on the horizontal axis and work remaining on the vertical axis. As time progresses and items are drawn from the backlog and completed, a plot line showing work remaining may be expected to fall. The amount of work may be assessed in any of several ways such as user story points or task hours. Work remaining in Sprint Backlogs and Product Backlogs may be communicated by means of a burn-down chart. See also: Burnup Chart”11 ↩
-
“Burn-up Chart: a chart which shows the amount of work which has been completed. Time is shown on the horizontal axis and work completed on the vertical axis. As time progresses and items are drawn from the backlog and completed, a plot line showing the work done may be expected to rise. The amount of work may be assessed in any of several ways such as user story points or task hours. The amount of work considered to be in-scope may also be plotted as a line; the burn-up can be expected to approach this line as work is completed.”11 ↩
-
“Cumulative Flow Diagram (CFD). A chart indicating features completed over time, features in other states of development, and those in the backlog.12 ↩
-
Project Management Institute (2021) - A guide to the project management body of knowledge (PMBOK® guide) (7th ed.) ↩